
Small Companies. Small Returns?
How have we done this year? This is the question many investors will be asking themselves as 2023 comes to a close.
Through December 1, the S&P 500 is up about 21.5%, including dividends. Growth investors have bounced back from 2022’s brutal year with a vengeance. Big growth stocks (Russell 1000 Growth) are up 37%, which basically gets them back to where they began 2022.
But what about smaller companies? By comparison, 2023 has been another lackluster year for small caps, up just 7%. I wanted to take a closer look at small caps and try to frame recent performance with some historical context.
Summary
This post got a little more technical than I originally intended, so in case you prefer the Cliff’s notes version, here’s my best attempt at that. Or, scroll down to watch the video.
Traditional theory suggests investors taking more risk should earn higher returns. Small caps are typically viewed as riskier than bigger companies. However, small cap stocks have underperformed large caps for more than a decade. They have even underperformed bigger, more stable stocks since the late 1970s! Which begs the question: why own smaller, riskier companies if we aren’t earning higher returns?
The ultimate K.I.S.S. investing mantra is buy low, sell high. Only time will tell, but patient investors may be facing an opportunity with small caps. We can buy $1 in small cap profits for about $13 today. It takes about $24 to buy the same $1 in profit for large caps. All else being equal, who wouldn’t prefer to pay less for something? The last time these ratios favored smaller companies to this degree was the late 1990s, right before small caps went on to deliver outsized returns for more than a decade.
Invest long enough and you will surely have your convictions tested. That could be happening for owners of small companies right now. However, for long-term investors, history suggests it may be wise revisit reasons for owning and perhaps give these stocks some patience.
What are small cap stocks?
While the definition of “small” is debatable, I’m going to use the Russell 2000 Index as a proxy. The index includes nearly 2000 smaller publicly traded companies with an average market capitalization of $2.7 billion and is widely used as a benchmark for small cap performance. There’s a good chance you won’t recognize many of these businesses. At least not yet. Some of the better companies will eventually grow their way into your lives.
Generally speaking, small caps are expected to be riskier than their larger cap counterparts, and you’ve probably heard that taking more risk should be accompanied by earning higher expected returns.
Where’s the beef, er, returns?
I really wanted to compare returns from those small caps to the biggest mega caps, so I used the Russell 2000 as the small cap proxy and the Russell Top 200 Index to represent big companies. And while the names of small caps are often unrecognizable, the Top 200 constituents are household names like Apple, Microsoft, Amazon.com, and Berkshire Hathaway, to name a few.
To do this, we looked at over 40 years of returns. Here is what the data show from 1979 through the end of last month.
Since 1979, $1 invested in small companies would now be worth $96. Not too bad! But nowhere close to what the mega caps have done. That same $1 invested in the biggest companies would have grown to nearly $140 over that same time period.

Should we even own small companies?
Some may wonder, after seeing that chart, why would I own these more volatile smaller companies when it doesn’t seem like investors have been rewarded for the extra risk?
It’s a fair question.
Let’s take a close look, starting by manipulating the previous chart a bit. The next chart shows the same data, but it highlights which group - small or mega cap stocks - is performing better. When the line is moving up and to the right, small companies are outperforming. And when the line moves down and to the right, mega caps are doing better. It shows performance relative to one another.
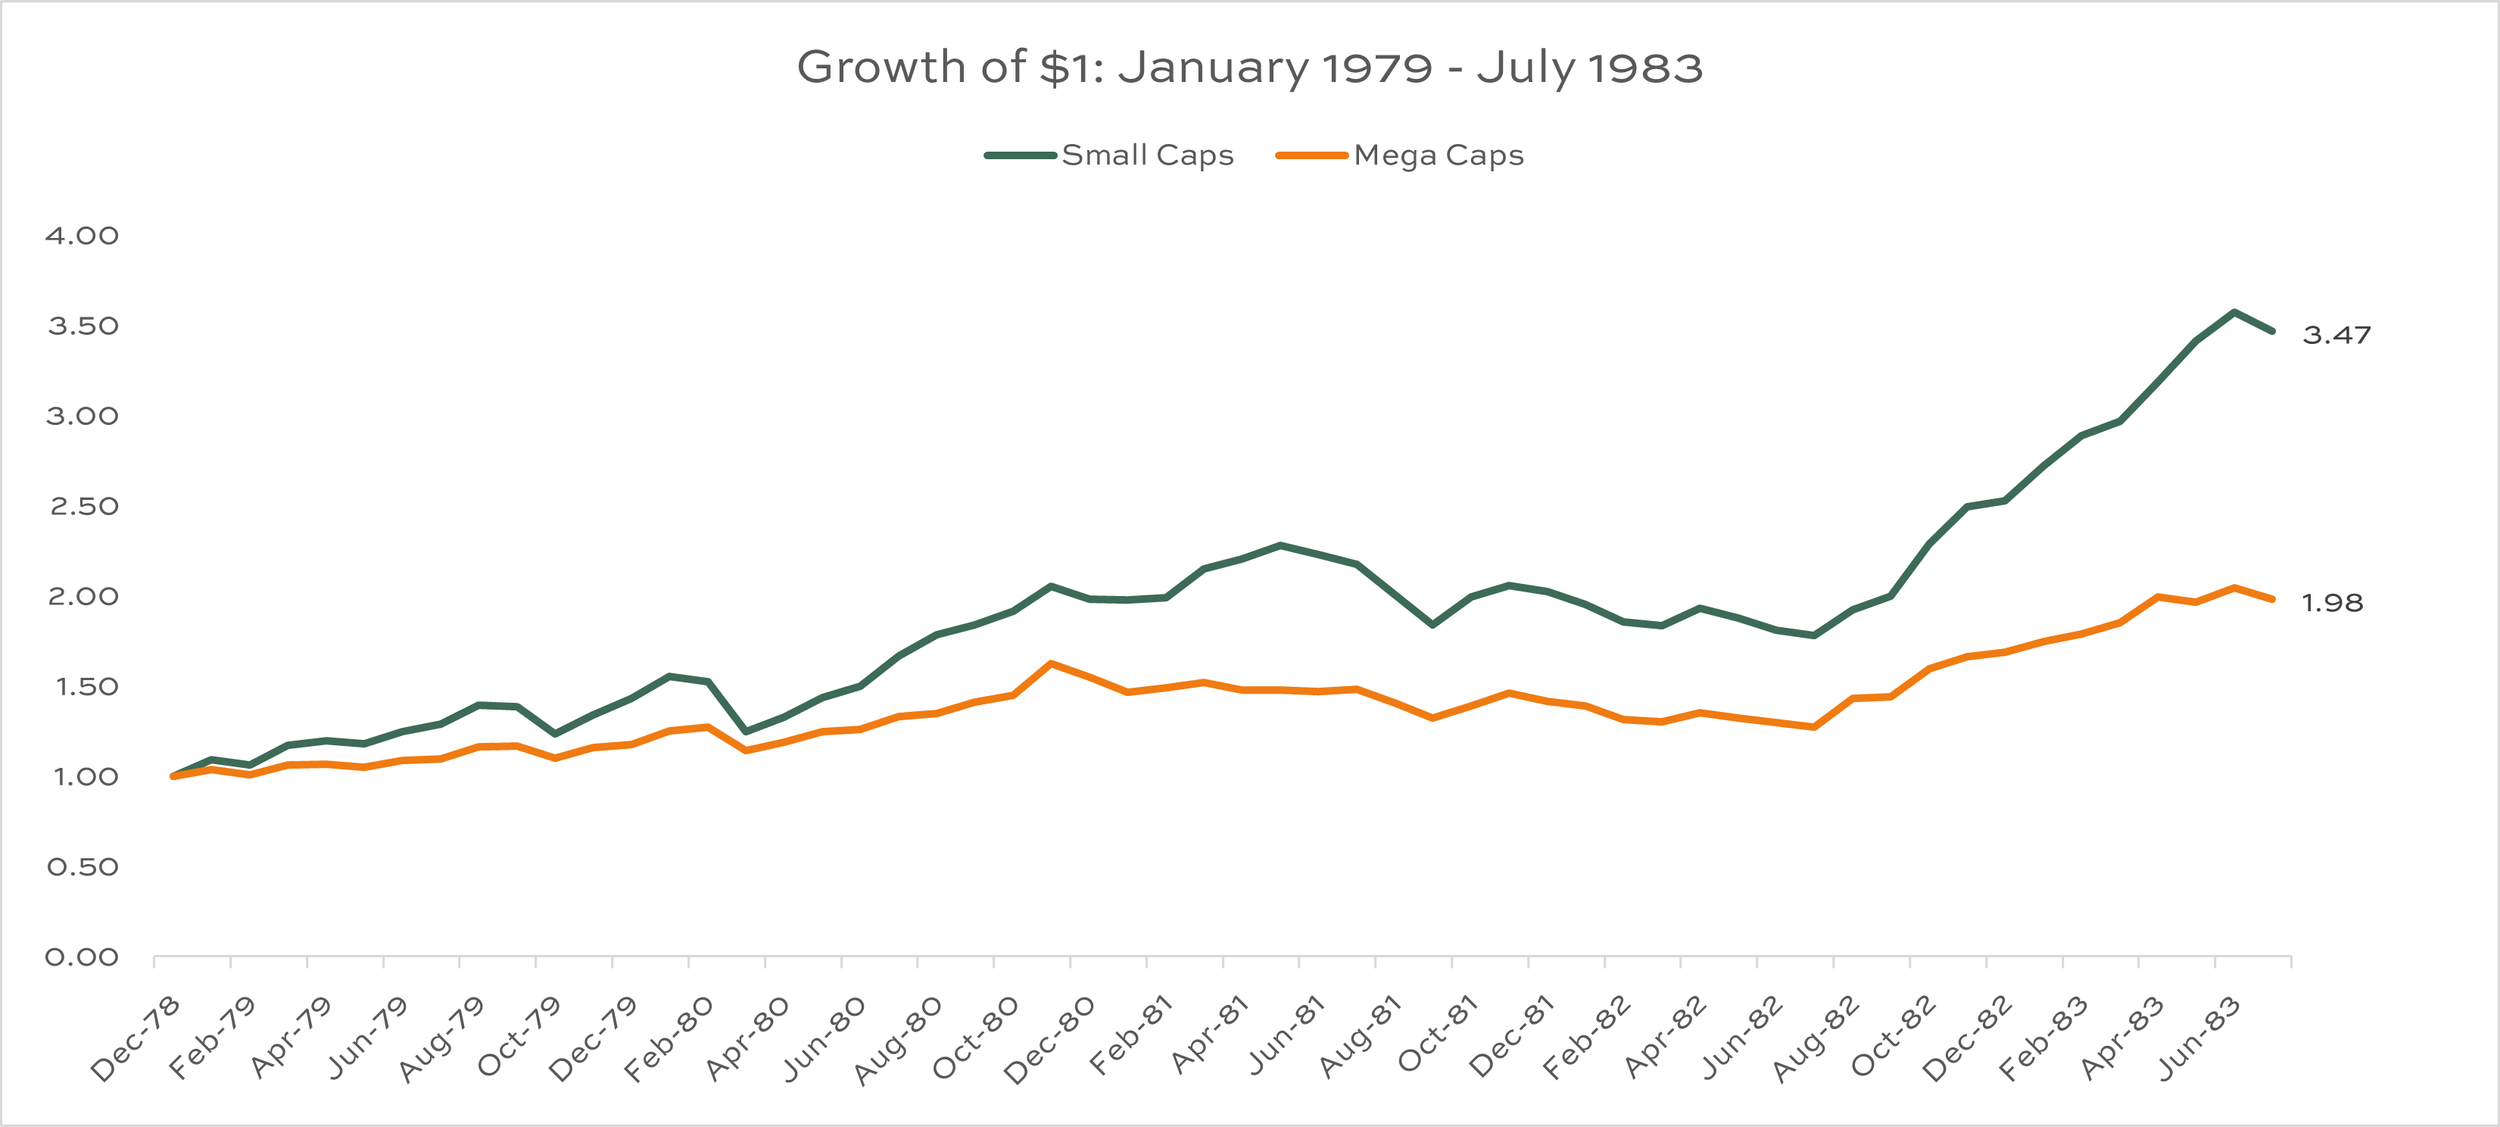
There seem to be four distinct periods with long-term trends. And I used the extremely scientific eyeball test to identify these periods:
January 1979 - July 1983: small caps outperform
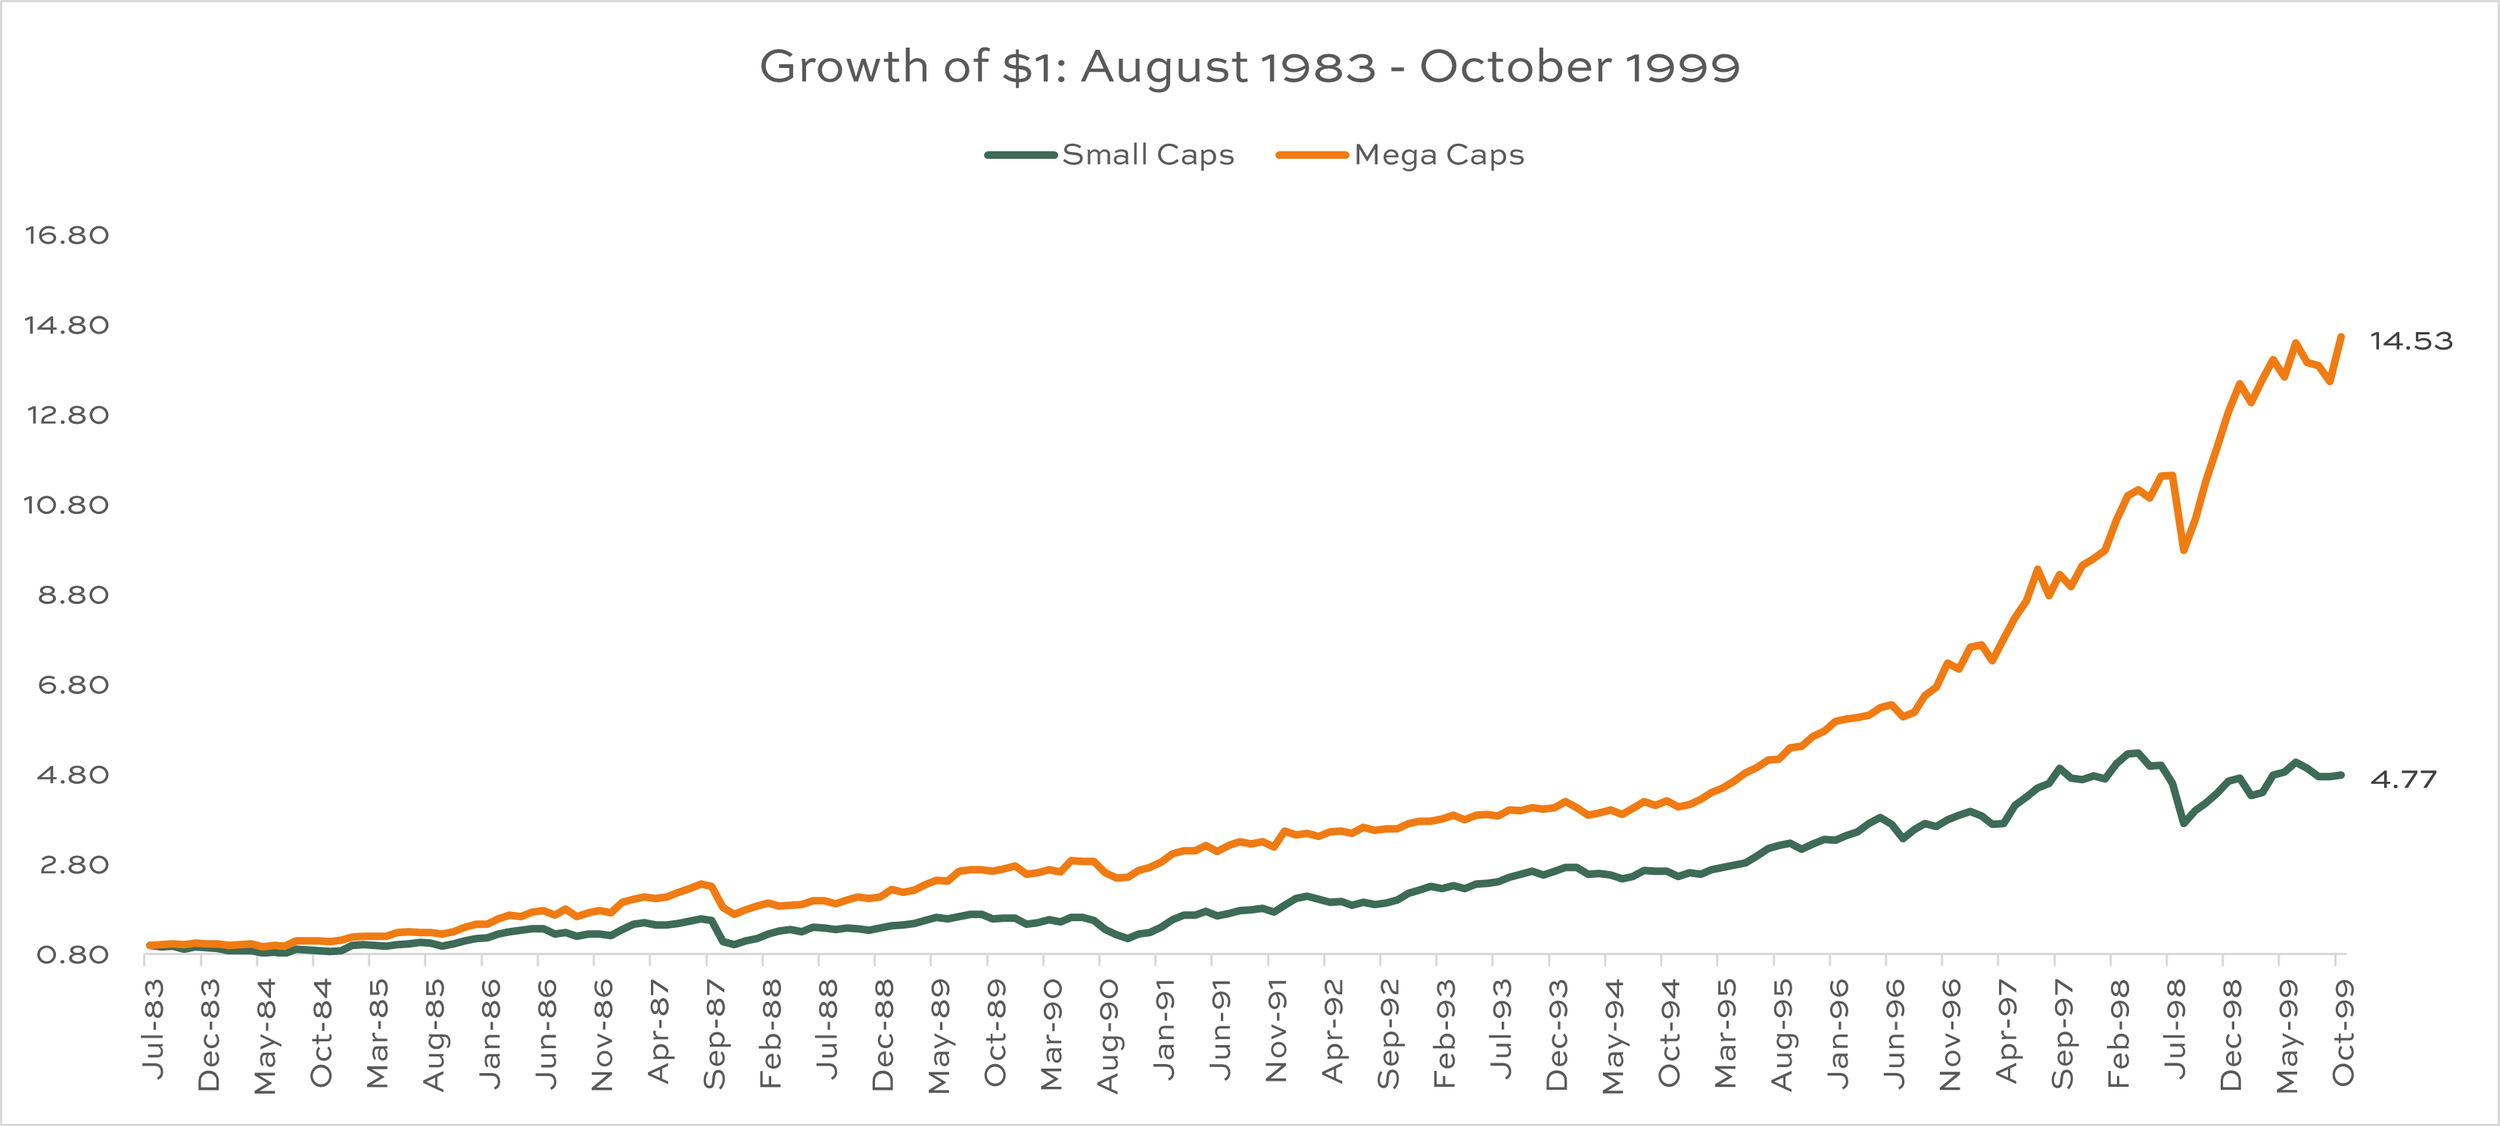
August 1984 - October 1999: mega caps outperform
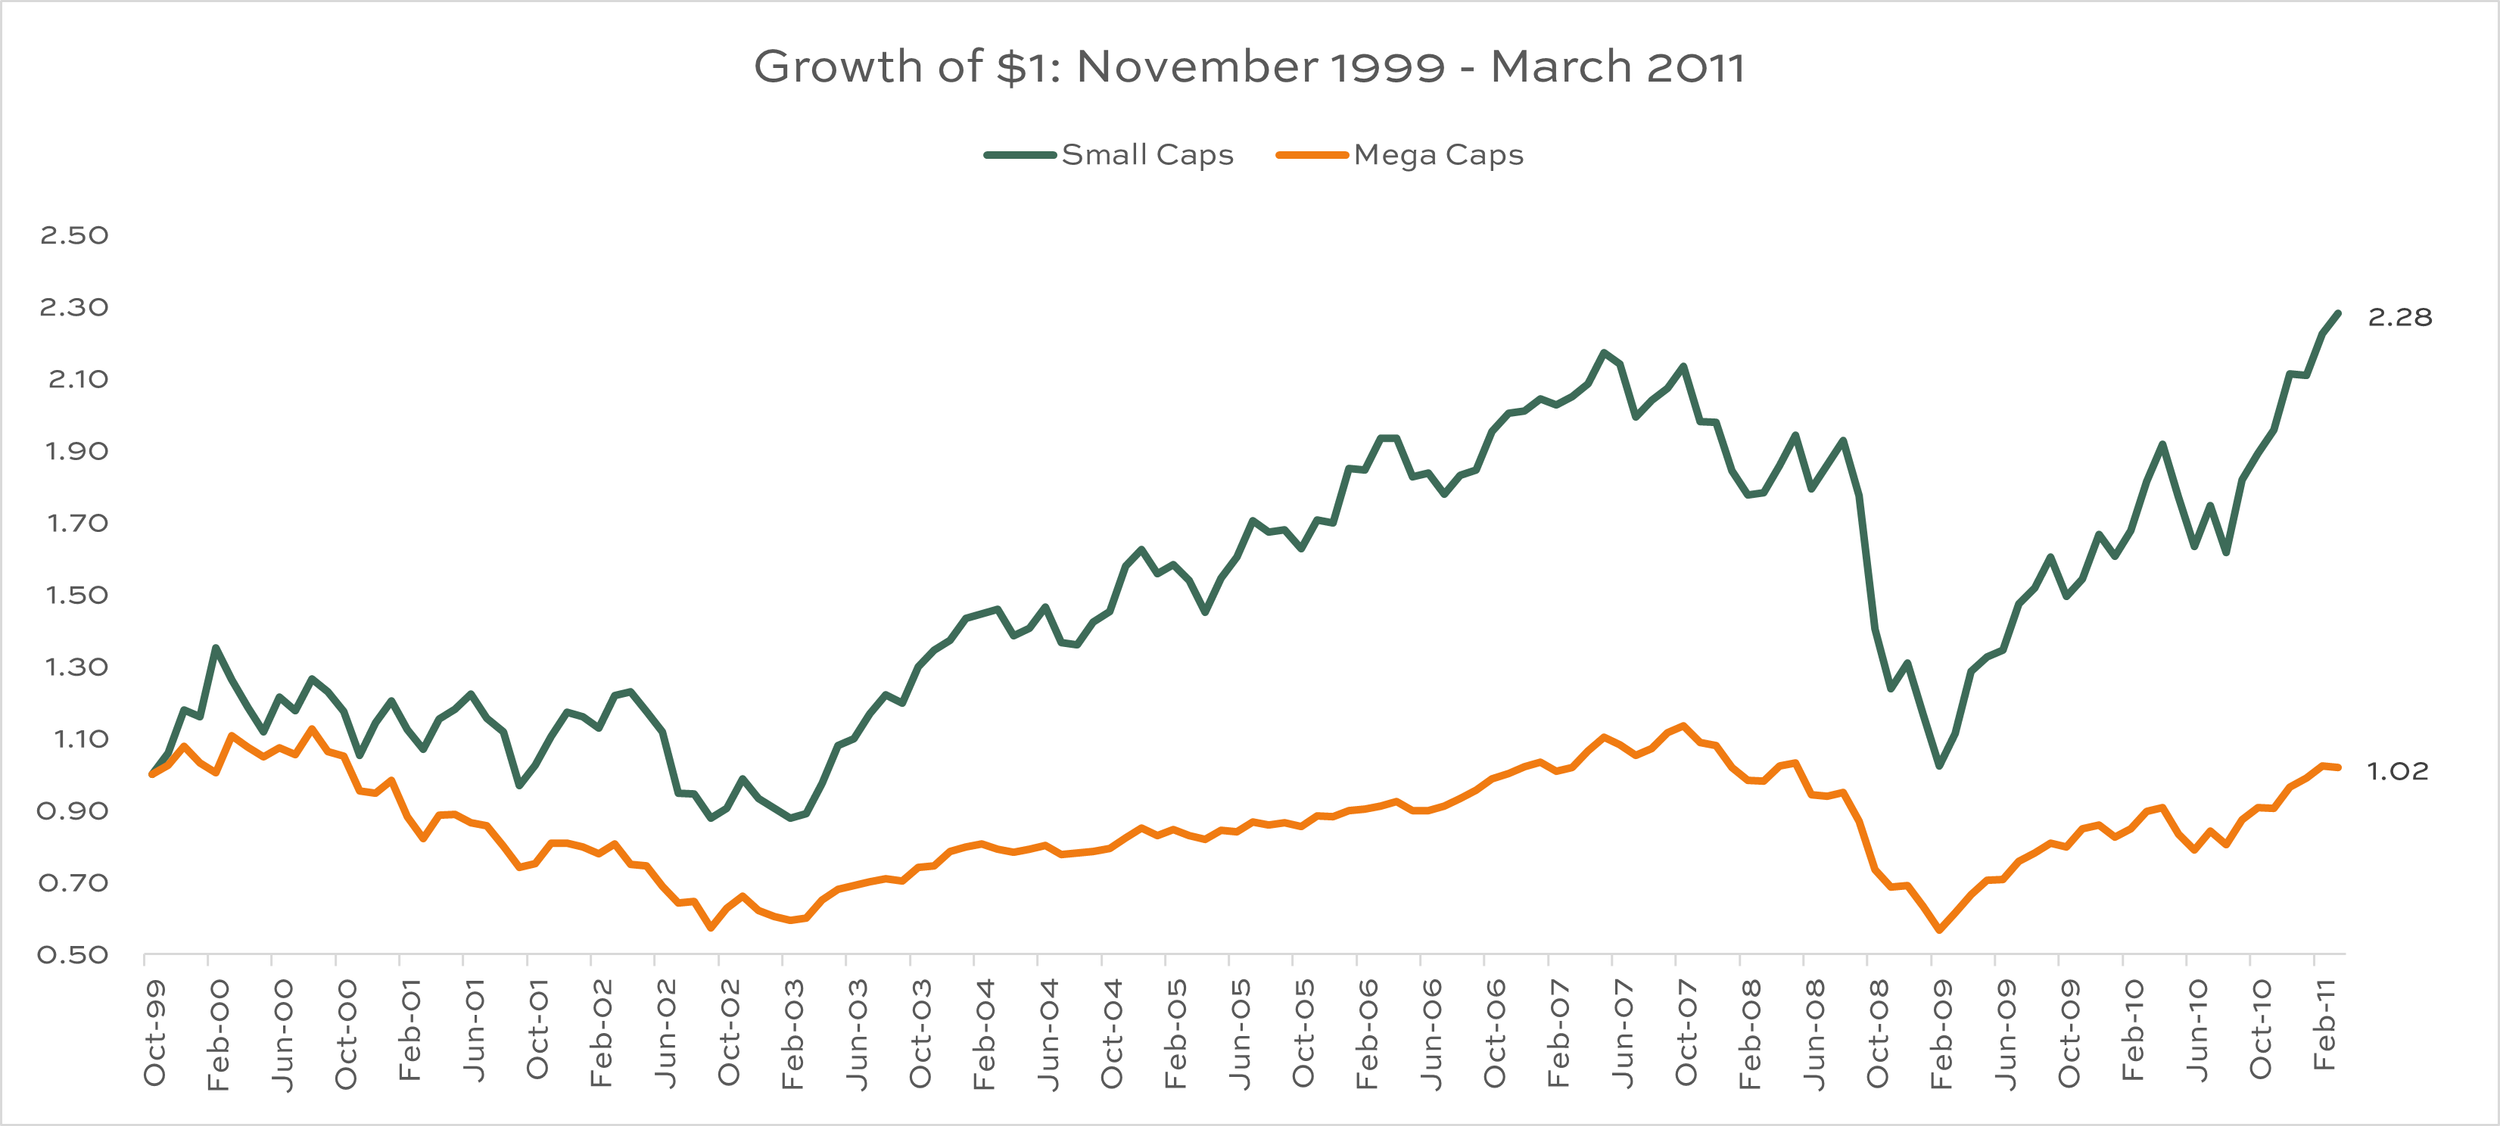
November 1999 - March 2011: small caps outperform
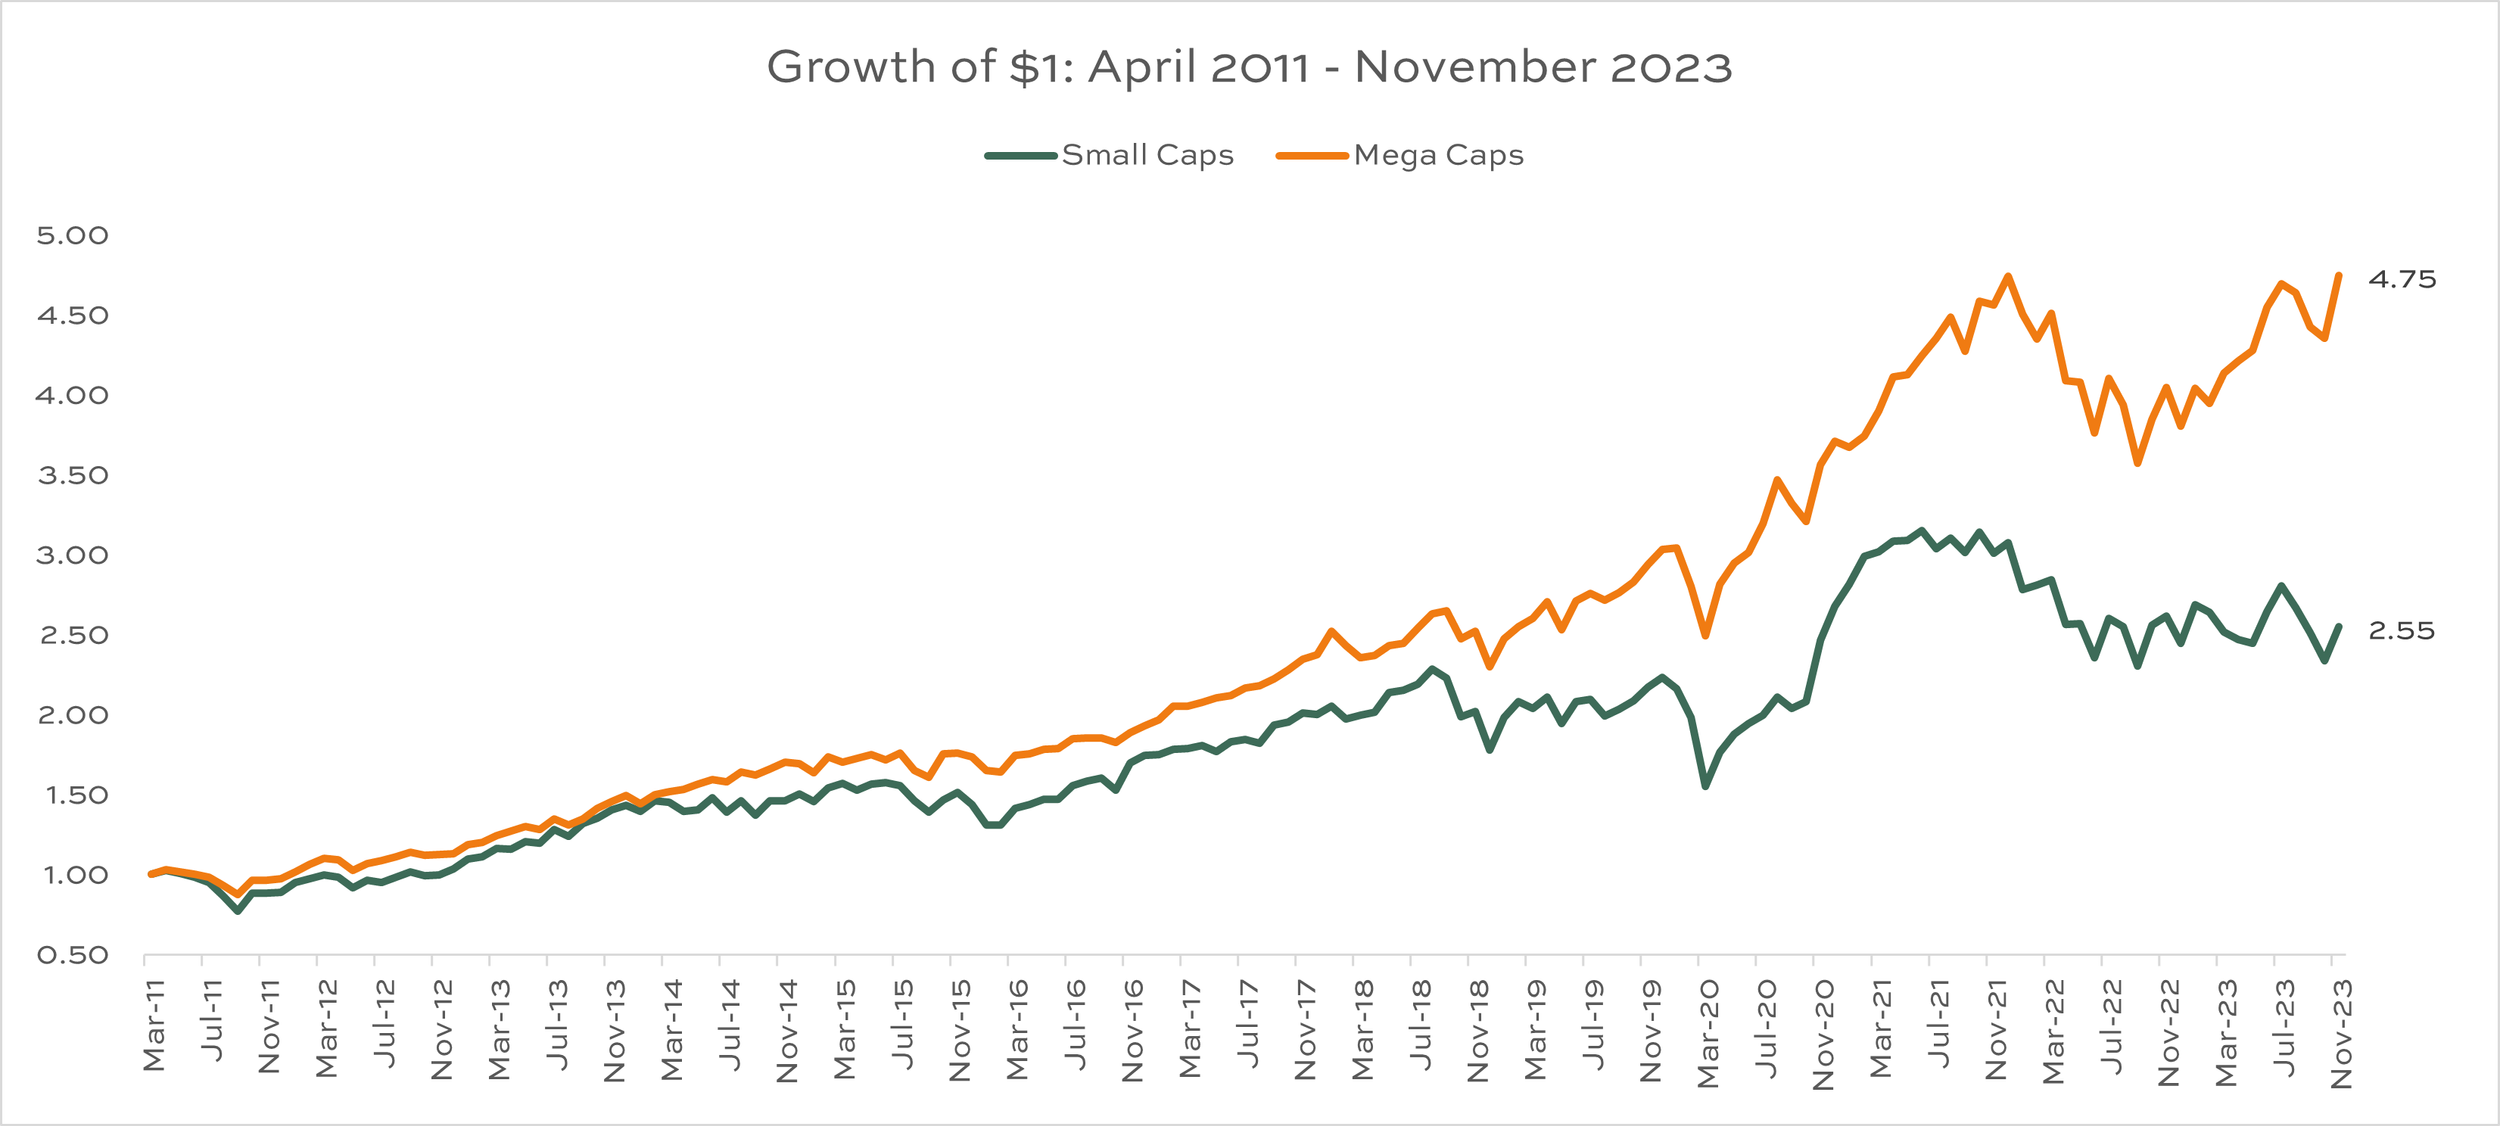
April 2011 - Present: mega caps outperform
Scroll through the individual charts for a better look at each period:
Is there an opportunity in small caps today?
After 12 years of underperformance, why would small caps outperform going forward? They may not! But if they do, one possible reason could be valuation.
Historically, one of the best ways to underperform for long periods of time has been to overpay. Stock returns are generally driven by inflation, real earnings growth, dividends, and a valuation component. The math is pretty straightforward.
For example, if we expect 2% inflation, 3% real earnings growth, and 1% in dividends, we might expect stocks to return 2 + 3 + 1 = 6%, before considering the valuation piece. Let’s say price-to-earnings ratios move higher during that period. Your returns would be enhanced.
Assume $1.00 in earnings per share, and we initially pay 15 times those earnings to buy a share of the stock. That means the stock price is $15 per share.
If those earnings grow by 5% to $1.05, and we still pay 15 times those earnings, the stock price should be $15.75, and we will have made a 5% return.
But if investors are now willing to pay 16 times those earnings to buy a share of stock, the price rises to $16.80. The total return is now 13% (16.80 final price divided by 15.00 initial price, plus the 1% dividend).
In case I am doing a poor job explaining this, just know it is much more fun and much more profitable to own stocks when those valuation multiples are rising.
Falling P/E multiples have just the opposite effect. Good earnings growth and a little inflation will have a difficult time overcoming a stock that is falling out of favor with investors. Using that same stock example from above, but swapping a 13 P/E multiple for the 16 multiple means you would actually lose 8% on your money.
reason to hope?
Back to the point. If small caps offer hope from here, I think it is in the form of valuation. Here is a table and one fun stat (for my fellow nerds, anyway) that might support this point. Click on the table to expand.
Hopefully you recognize the dates in the far left column of this table. These are the starting points, since 1999, of the last two small cap to mega cap regime changes, as well as the most recent data point from November 2023. The final two columns show their P/E ratios at those points in time.
When valuations for small caps were cheap relative to mega caps (November 1999), the subsequent relative returns for small caps were quite good.
And when valuations for small caps were expensive relative to mega caps (March 2011), subsequent relative returns for small caps were poor.
The final row looks much more similar to 1999 than 2023. And, finally, the “fun” stat I promised. Small caps have only been this cheap relative to mega caps 5% of the time since November 1999. The last time they were this cheap, at least through the lens of relative P/E ratios, was summer of 2000.
This should give patient, long-term small cap investors some hope, I think.
In investing, decisions rarely are a slam dunk. Perhaps mega caps continue to outperform for another decade. It’s true they represent higher quality businesses, have more exposure to sectors with faster growth like technology and communications services, and mega caps have momentum on their side. If the economy falls into a recession next year, small caps typically struggle more than their more stable, large cap alternatives in those environments.
But history and valuation suggest it might be wise to think twice before throwing in the towel on small caps.
Divvi Wealth Management (DWM) is a State registered investment adviser. Information presented is for educational purposes only intended for a broad audience. The information does not intend to make an offer or solicitation for the sale or purchase of any specific securities, investments, or investment strategies. Investments involve risk and are not guaranteed. DWM has reasonable belief that this marketing does not include any false or material misleading statements or omissions of facts regarding services, investment, or client experience. DWM has reasonable belief that the content as a whole will not cause an untrue or misleading implication regarding the adviser’s services, investments, or client experiences. Please refer to the adviser’s ADV Part 2A for material risks disclosures.
Past performance of specific investment advice should not be relied upon without knowledge of certain circumstances of market events, nature and timing of the investments and relevant constraints of the investment. DWM has presented information in a fair and balanced manner.
DWM is not giving tax, legal or accounting advice, consult a professional tax or legal representative if needed.
DWM may discuss and display, charts, graphs and formulas which are not intended to be used by themselves to determine which securities to buy or sell, or when to buy or sell them. Such charts and graphs offer limited information and should not be used on their own to make investment decisions. Consultation with a licensed financial professional is strongly suggested.
The opinions expressed herein are those of the firm and are subject to change without notice. The opinions referenced are as of the date of publication and are subject to change due to changes in the market or economic conditions, and may not necessarily come to pass. Any opinions, projections, or forward-looking statements expressed herein are solely those of author, may differ from the views or opinions expressed by other areas of the firm, and are only for general informational purposes as of the date indicated.