
1,464 Highs and Counting: Why the S&P 500's Record Run May Not be a Sell Signal
Since 1950 through the end of last week (January 26, 2024), the S&P 500 has closed at the all-time high (ATH) on 1,464 separate occasions.
Last Friday was just the most recent. Is the market saying it’s time to sell?
[Prefer video? Scroll to the bottom to watch.]
I don’t think so, at least not based on price alone, and here are my four main reasons:
Stocks should be long-term investments, intended to help reach long-term goals. History suggests the market can achieve good long-term returns from ATHs.
Value is more important than current price levels for long-term investors. Some of the world’s best investments carry high price tags, or in this case, share prices. That alone should not be a deterrent.
The S&P 500 is at ATHs. But many other pockets like small cap stocks and some foreign markets have not fared as well.
Frequent selling has a decision-making domino effect, forcing us to make more decisions, more often.
I’ll take a look at the first reason today and tackle the rest over the next couple weeks.
Stocks are long-term investmetns

To address #1, let’s review some historical data for U.S. stocks, using the S&P 500 as a proxy. Here is my case study:
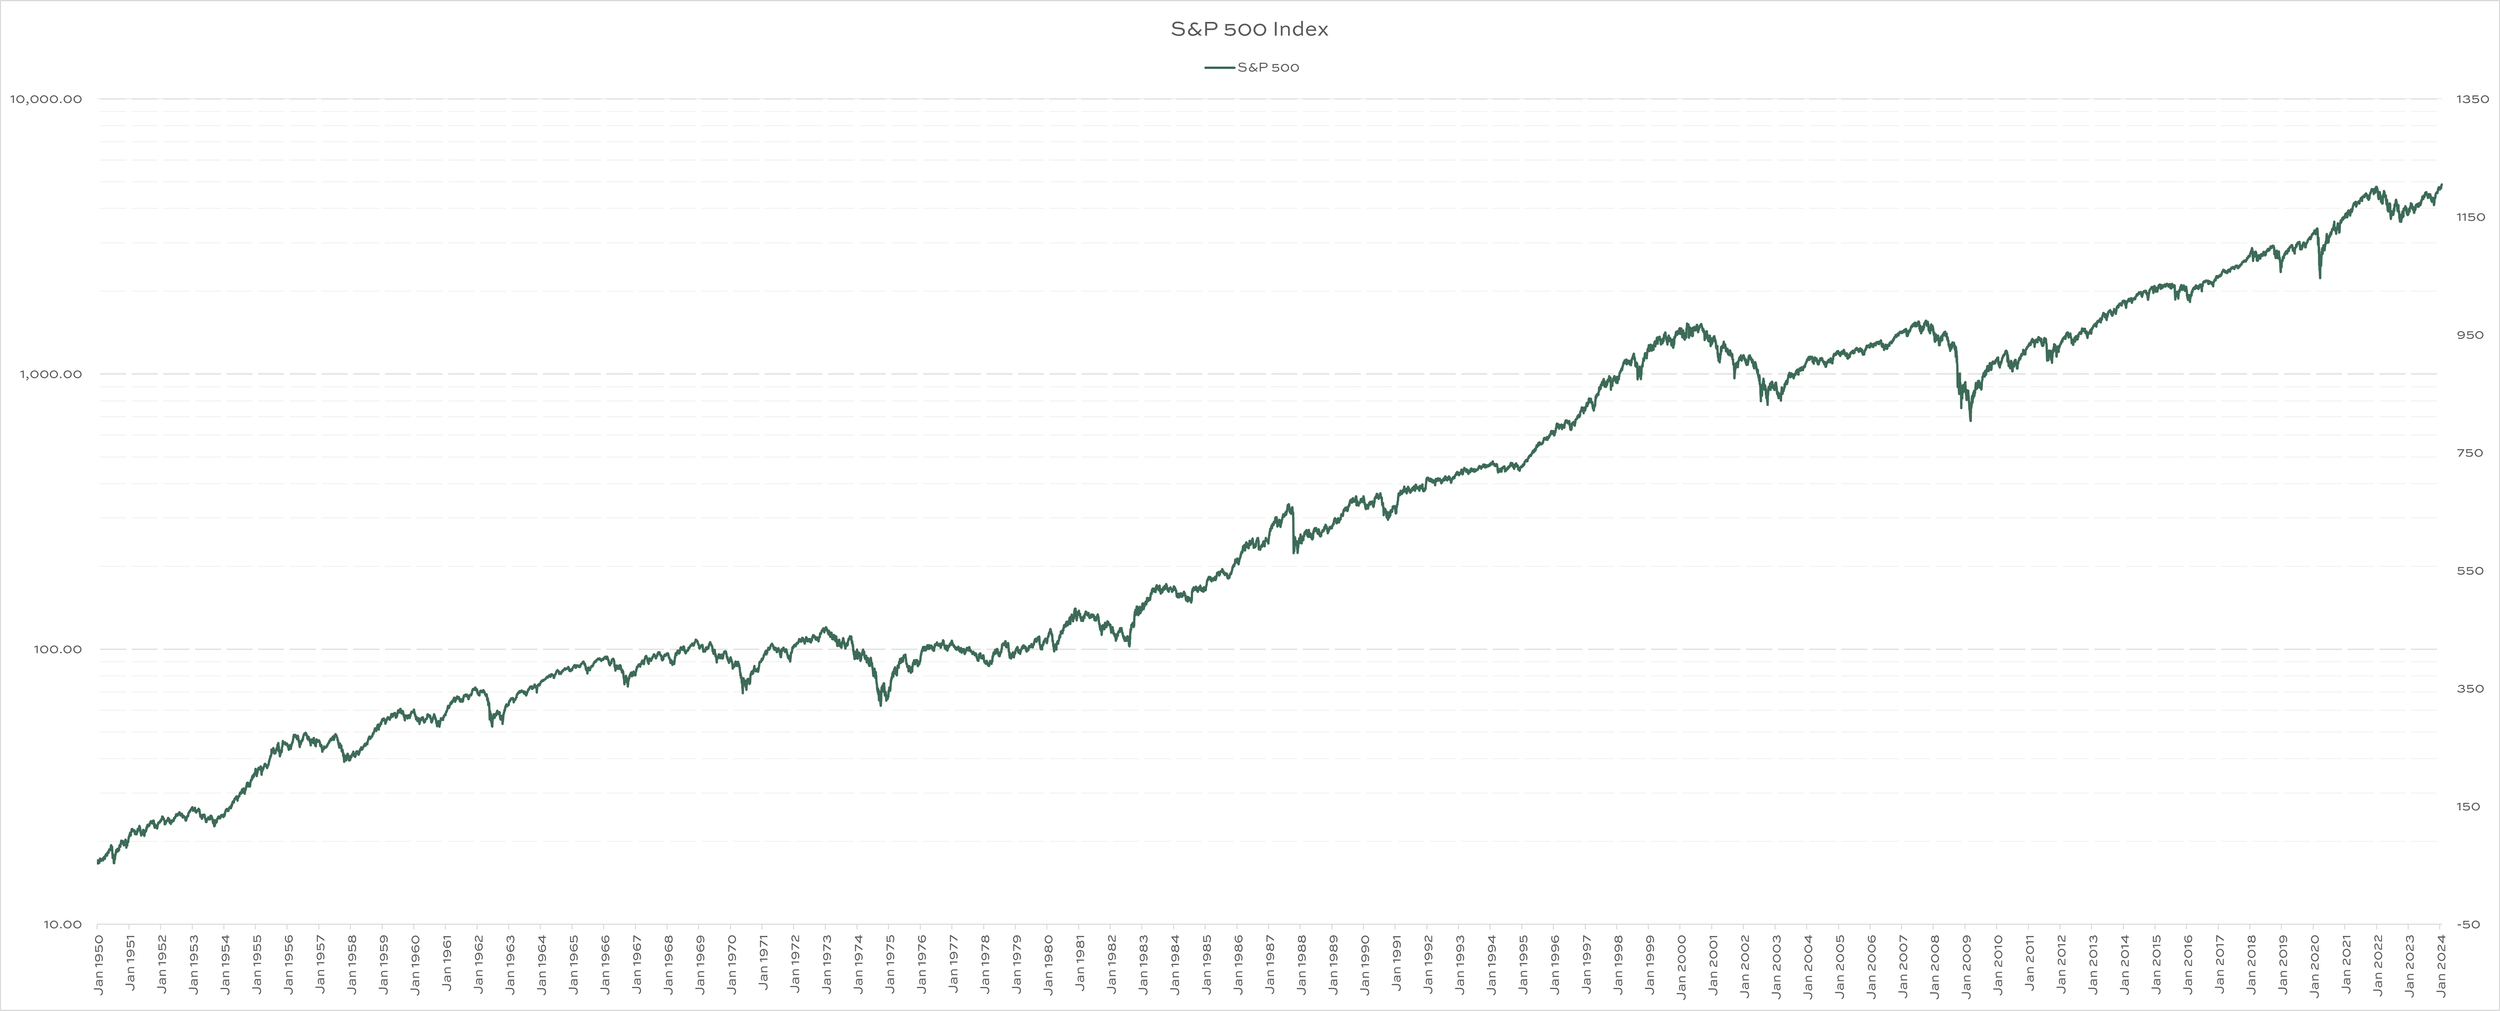
Look at the closing price of the S&P 500 every day since the beginning of 1950. That’s nearly 75 years worth of data.
Isolate each day the index closed at an ATH. As I mentioned in the beginning, that happened over 1,400 times.
Look at the future returns from each of those ATH days. How did buying at the ATHs work in the past?
Calculate the 1-year, 10-year, and 20-year returns from each ATH starting point.
Scroll through the images below:
The first is the S&P 500 since 1950. You’ll see some good stretches, and some not-so-good stretches. But the trend over the very long-term is clearly higher.
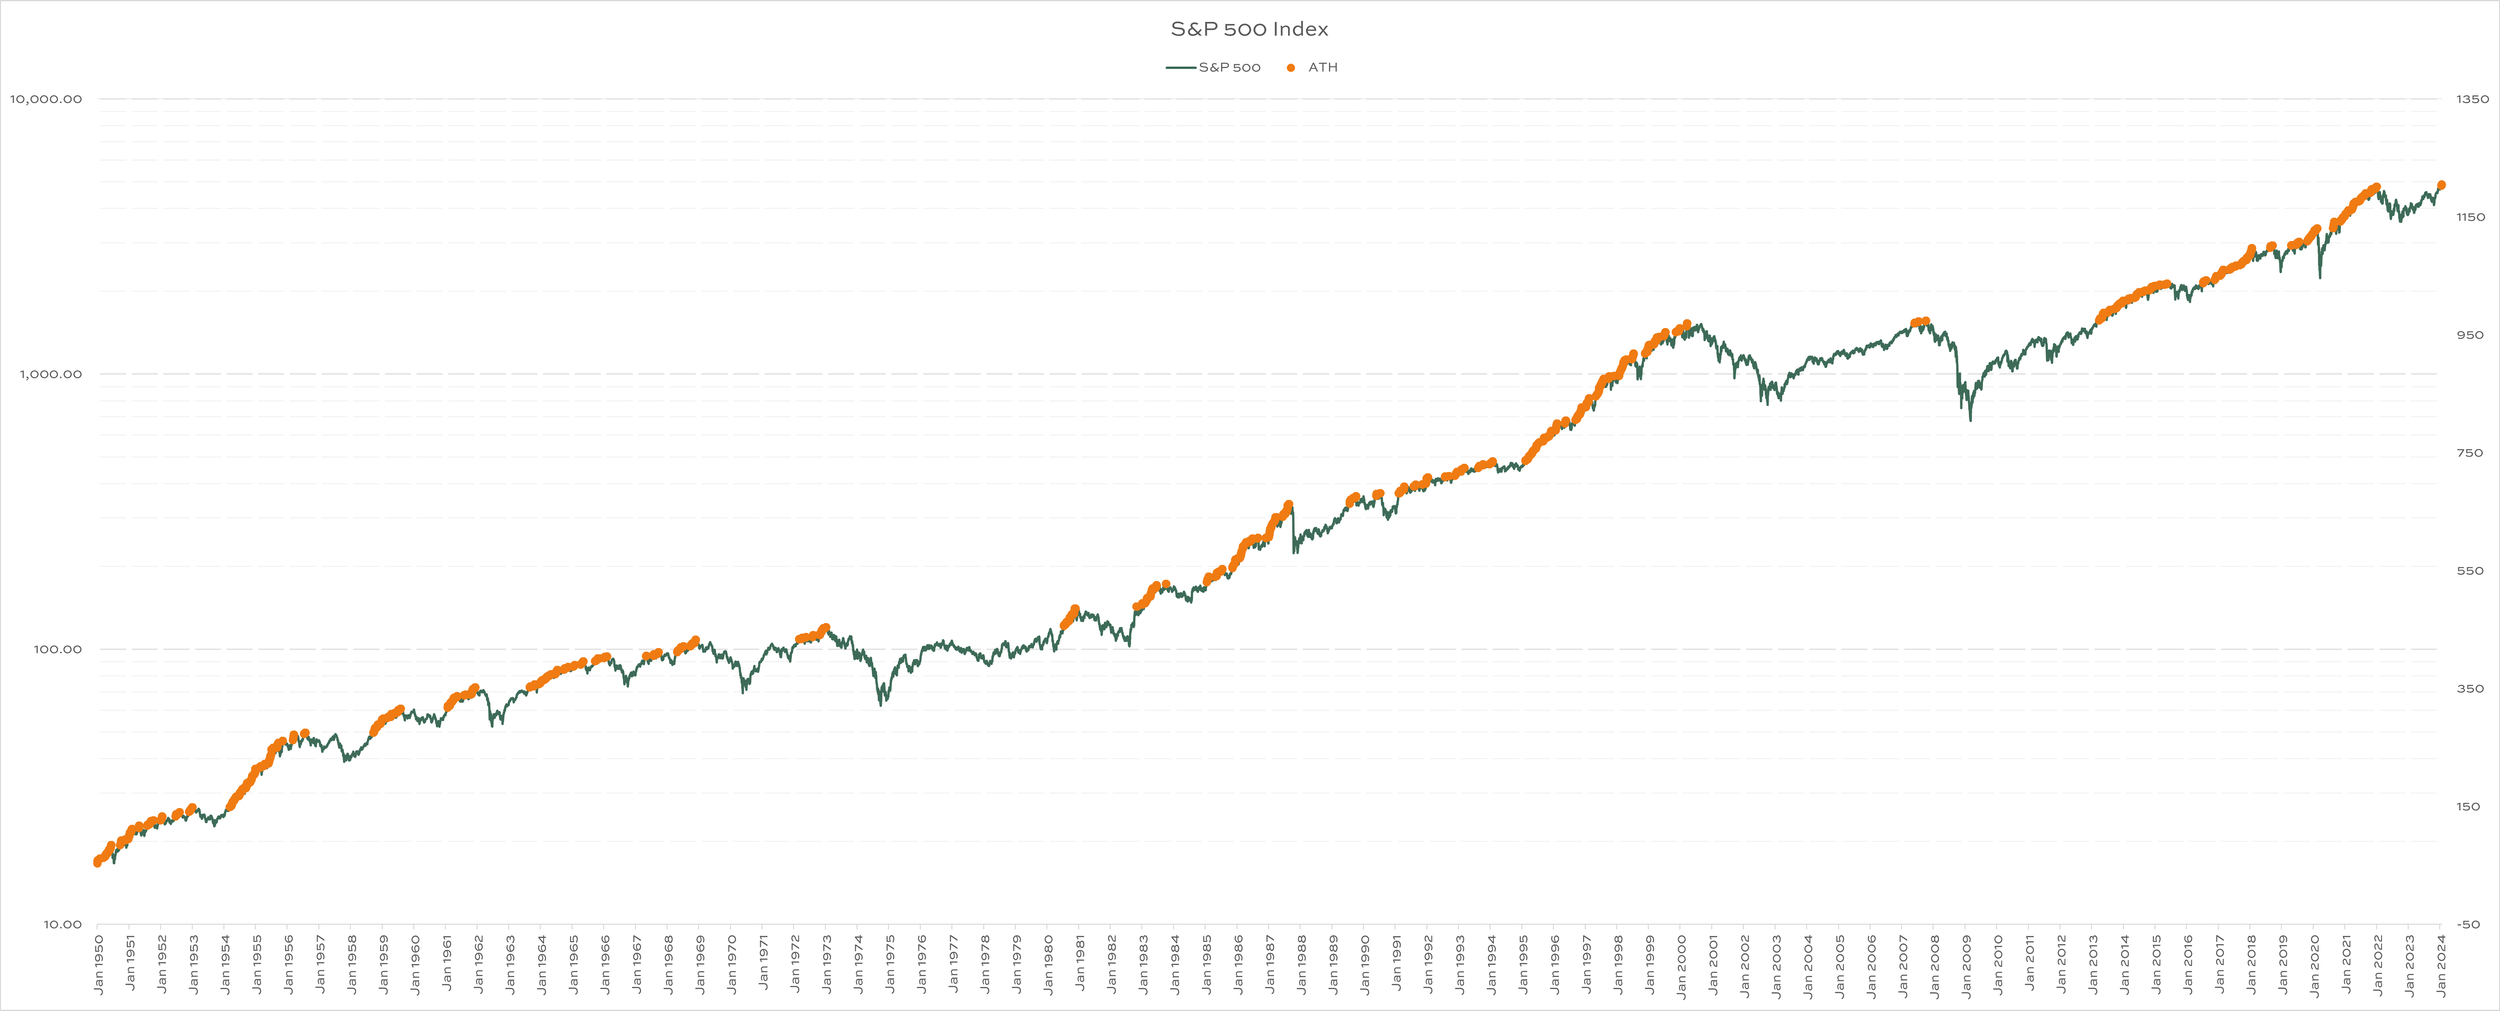
The second is the same chart, but with ATH dates identified by orange dots. U.S. stocks have been making new ATHs for years. We did, however, experience a few long stretches without new highs, mainly during the 1970s and 2000s.
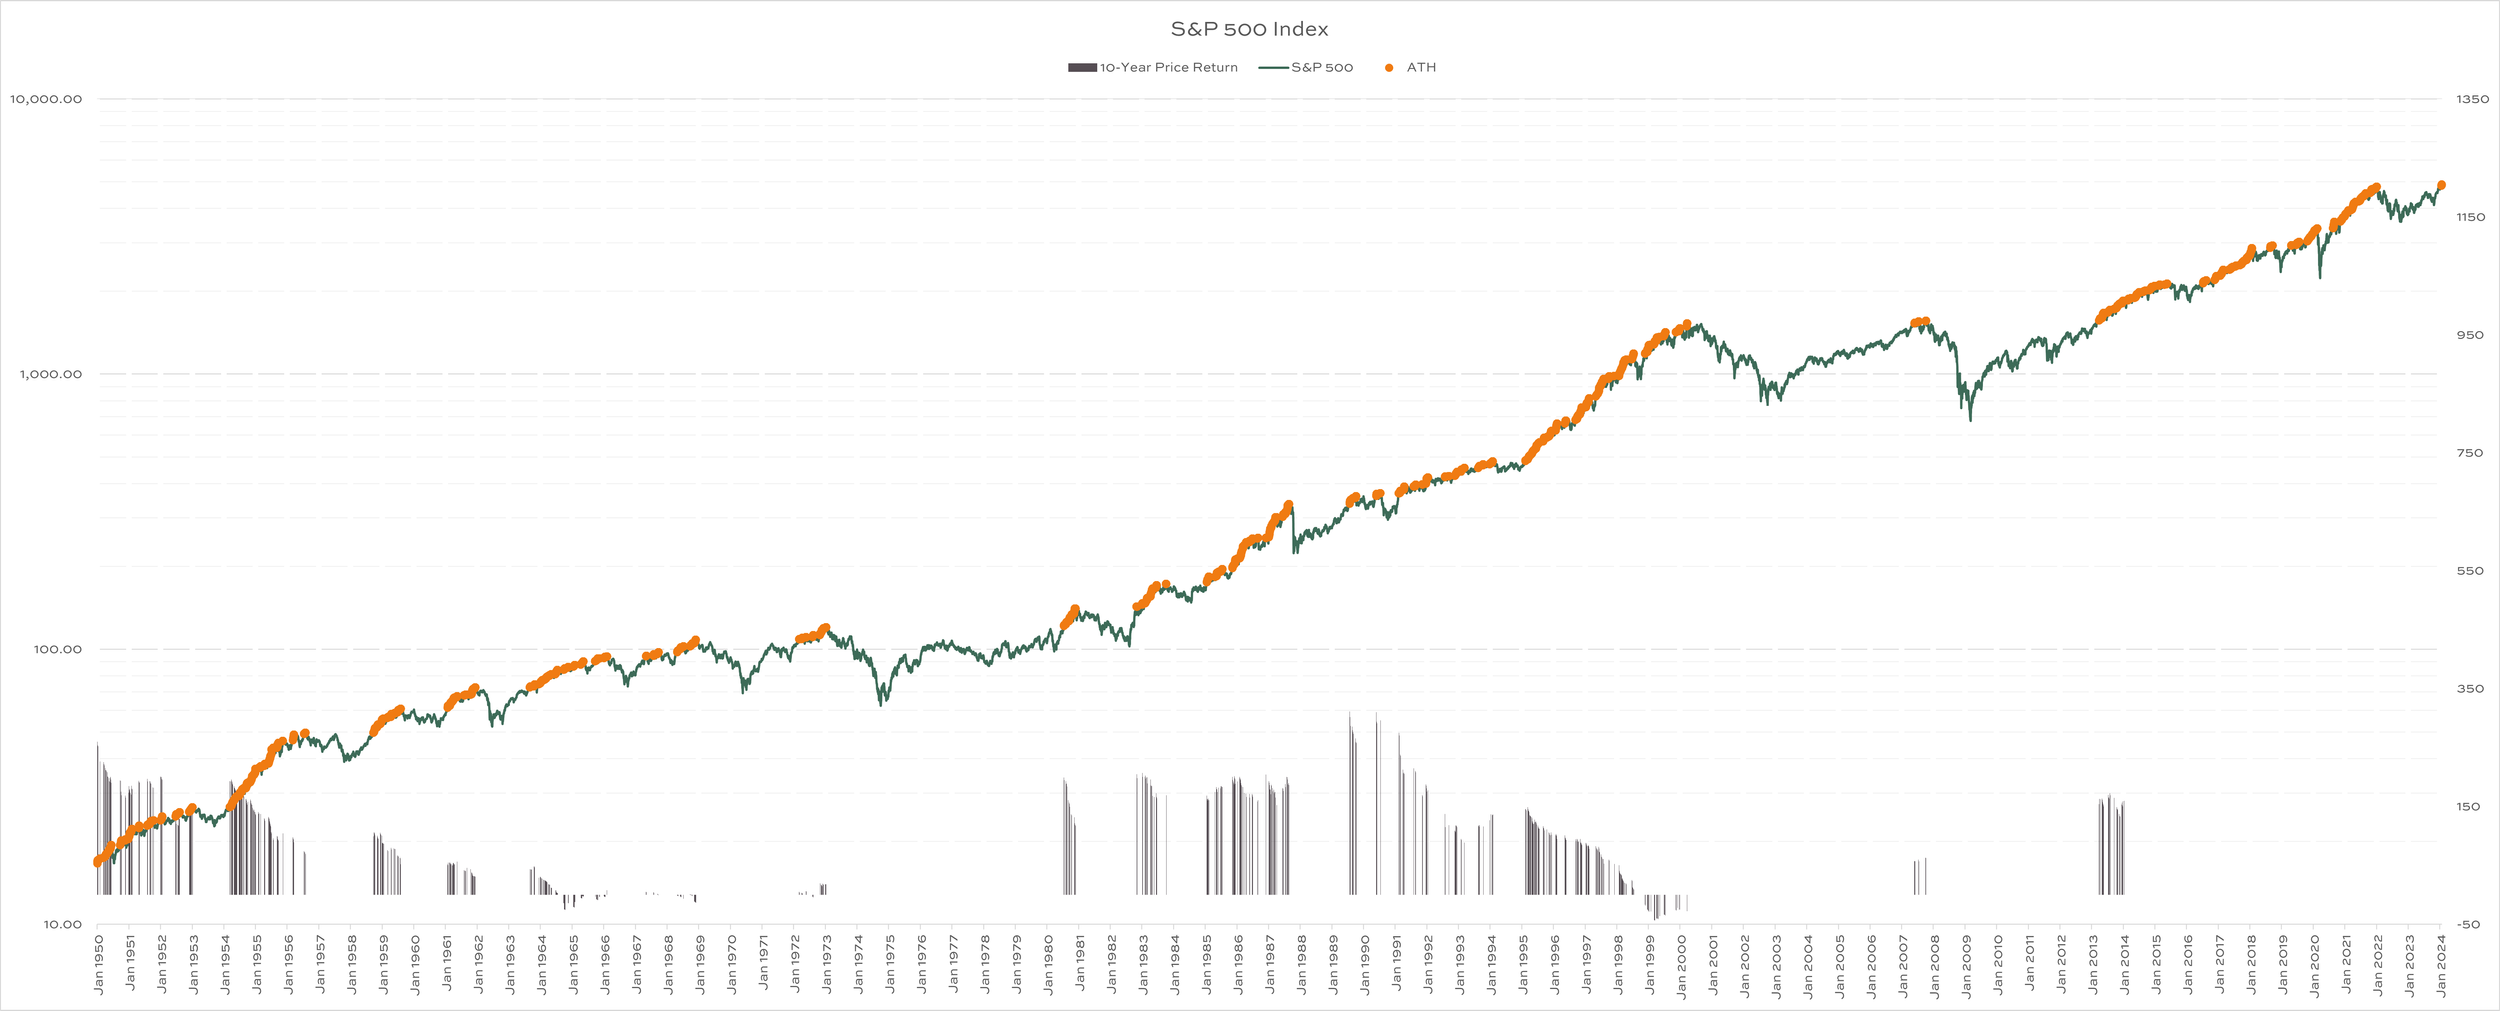
The third is the same chart, but it includes future 10-year returns (the columns at the bottom) from each of those ATH starting points. Lots of tall bars (i.e. positive stock market returns), but rough decades have happened. The market has actually fallen over a few of these 10-year periods, too. No one is promised 10% from stocks all the time.
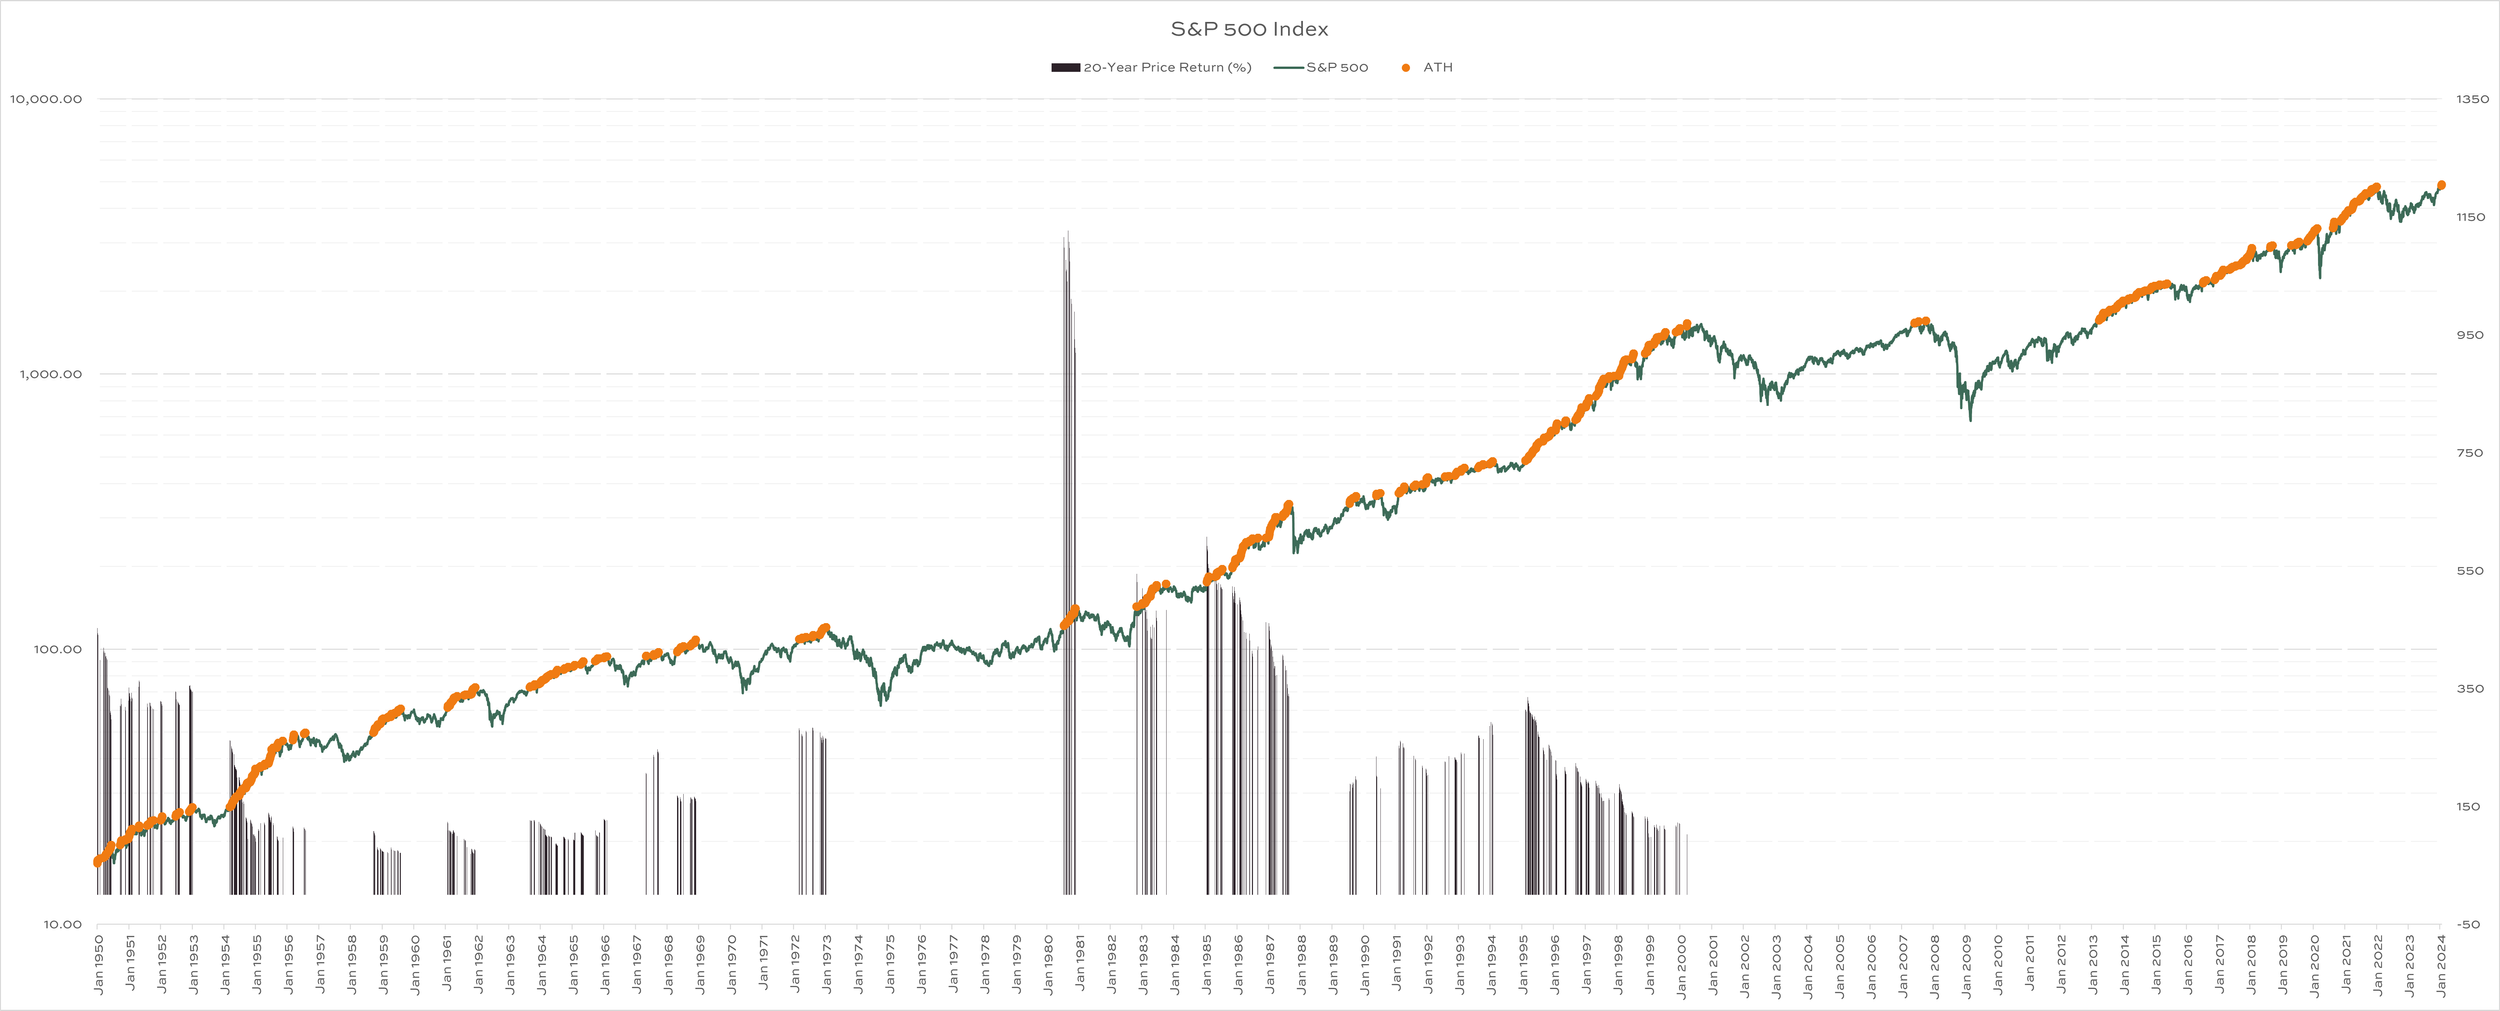
The fourth is the same chart, swapping 20-year returns in place of those 10-year returns. The S&P 500 has never earned less than 69% when starting at the high and looking forward two decades.
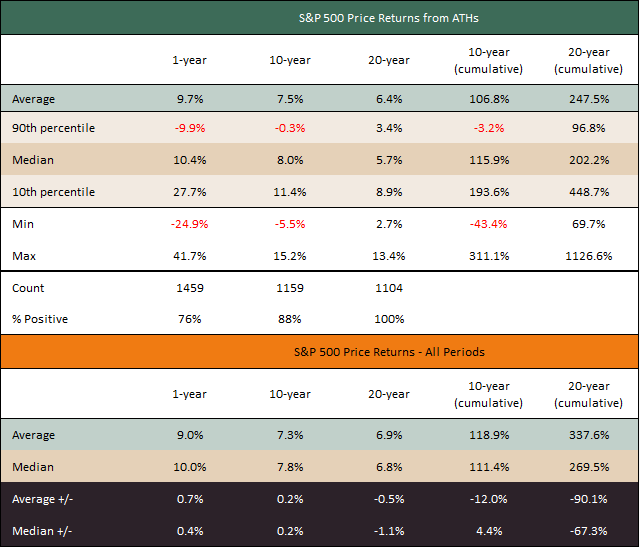
Finally, the fifth image is a table summarizing the data. Keep in mind, these returns don’t include dividends, which would improve all these results. If you agree stocks are long-term investments, take a look at the average and median 10-year and 20-year returns (the light green and dark brown rows). If we only look at those starting points where the S&P 500 was at all-time highs, the average and median return 10-year return has been nearly 8%, before we even consider dividends. Not bad.
How do the returns from ATHs compare to the returns from all periods? Look at the last two rows.
The average and median 10-year returns from ATHs are slightly better than the average and median returns from all periods since 1950.
20-year returns from ATHs, on the other hand, have trailed a bit.
What is your horizon?

So, what is your time horizon? It may be longer than you think.
According to the social security administration’s actuarial life tables, a 40-year old male and female should, on average, expect to live:
Another 37 years, for men
Another 41 years, for women
The average 60-year old man and woman should plan to live another 20 and 24 years, respectively.
We don’t just invest in businesses to grow wealth, although that has worked pretty darn well, too. Stocks usually make a ton of sense for people still in the accumulation phase of life (i.e. still working and saving).
Protecting our wealth is just as important, and great companies give us the opportunity to do that. Investors who take income from their investments to support spending needs should look to stocks for a way to keep up with inflation and protect purchasing power.
WHAT’S THE POINT?
If time is on your side, think twice before letting news of ATHs dissuade you from owning good companies. Don’t assume high prices imply poor value. Instead, consider revisiting what you own and evaluate the risks in your portfolio. Are the risks aligned with your goals? Go back to your original investment strategy. If you don’t have one, take the time to put into writing what you want your money to accomplish. It can help remove emotion from decision making in times like this.
Lastly, if you expect to need money in the next few years, owning stocks was probably a poor choice on the front end!
As always, let the Divvi team know if we can help. Schedule a call with your advisor or to meet the team by clicking the button below.
Divvi Wealth Management (DWM) is a State registered investment adviser. Information presented is for educational purposes only intended for a broad audience. The information does not intend to make an offer or solicitation for the sale or purchase of any specific securities, investments, or investment strategies. Investments involve risk and are not guaranteed. DWM has reasonable belief that this marketing does not include any false or material misleading statements or omissions of facts regarding services, investment, or client experience. DWM has reasonable belief that the content as a whole will not cause an untrue or misleading implication regarding the adviser’s services, investments, or client experiences. Please refer to the adviser’s ADV Part 2A for material risks disclosures.
Past performance of specific investment advice should not be relied upon without knowledge of certain circumstances of market events, nature and timing of the investments and relevant constraints of the investment. DWM has presented information in a fair and balanced manner.
DWM is not giving tax, legal or accounting advice, consult a professional tax or legal representative if needed.
DWM may discuss and display, charts, graphs and formulas which are not intended to be used by themselves to determine which securities to buy or sell, or when to buy or sell them. Such charts and graphs offer limited information and should not be used on their own to make investment decisions. Consultation with a licensed financial professional is strongly suggested.
The opinions expressed herein are those of the firm and are subject to change without notice. The opinions referenced are as of the date of publication and are subject to change due to changes in the market or economic conditions, and may not necessarily come to pass. Any opinions, projections, or forward-looking statements expressed herein are solely those of author, may differ from the views or opinions expressed by other areas of the firm, and are only for general informational purposes as of the date indicated.